|
STACKED
|
|
|
| The Carry Trade in Disguise |
Bitcoin's funding rate is at -5%. On its face that's bearish.
Look closer and it's the most bullish signal in the data. |
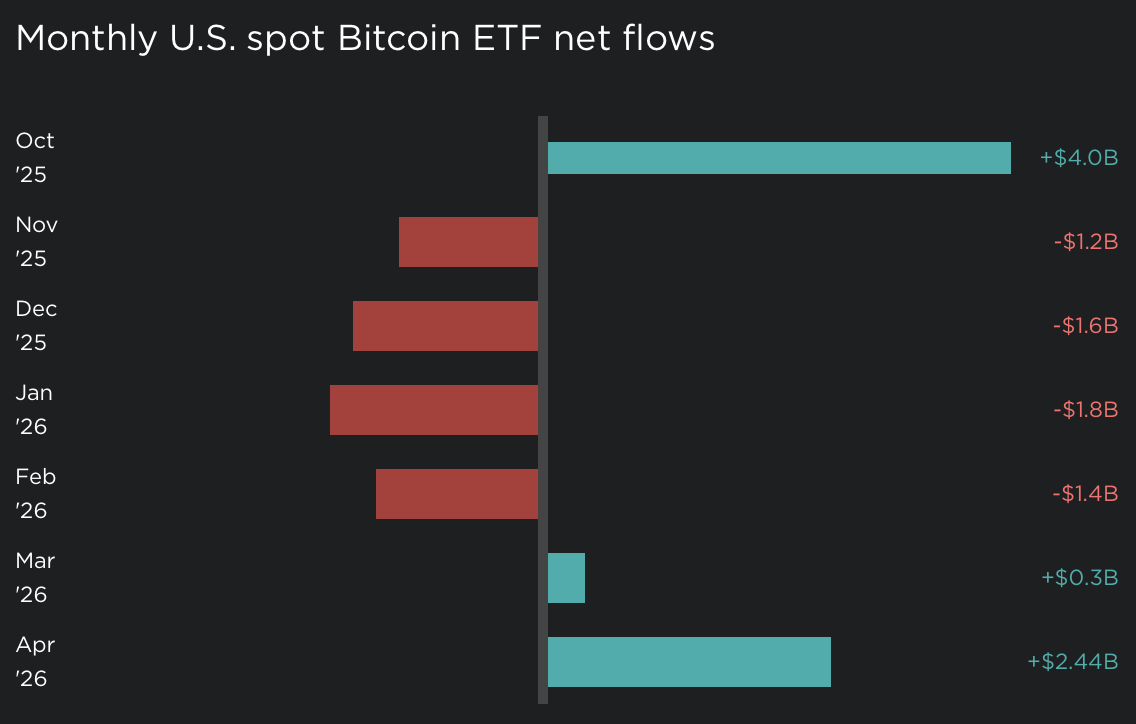
| April was the strongest month for spot Bitcoin ETF inflows since October 2025 - $2.44 billion of fresh institutional capital. At the same time, the Bitcoin futures funding rate dropped to its lowest 30-day average in years. Standard market interpretation says these two things shouldn't happen together. They are happening together because something structural has shifted in how institutions hold Bitcoin. This week we unpack what the on-chain data is actually telling us, and why the current fear environment may be the setup, not the warning. |
|
FUNDING RATE
-5%
vs +8% norm
|
|
RHODL RATIO
4.5
3rd highest ever
|
|
APRIL ETF INFLOWS
$2.44B
strongest since Oct
|
|
| The anomaly: a bearish signal that isn't bearish |
|
Funding rate, in one line: a small fee paid every 8 hours between long and short futures traders to keep the futures price tethered to the spot price - positive when longs are dominant, negative when shorts are dominant.
Bitcoin's 30-day average funding rate on Binance has dropped to -5%, against a historical norm closer to +8%. Read at face value, that says shorts are running the table - paying longs to maintain bearish positioning.
The problem with the face-value reading is that it doesn't match what the rest of the market is doing. Bitcoin rallied 15% through April. Options skew - the relative cost of downside protection versus upside calls - has recovered. ETF inflows hit their strongest monthly figure since last October. Sentiment has improved across every measure except the futures funding rate.
When one signal contradicts everything else, the question to ask is whether you're reading sentiment, or reading something else entirely.
|
|
CHART 1
Funding rate falls while price rises - the divergence
BTC PRICE (rising)
| Mar 1 |
|
$68k |
| Mar 22 |
|
$71k |
| Apr 12 |
|
$74k |
| May 1 |
|
$77k |
| Today |
|
$78k |
FUNDING RATE (falling, into negative)
| Mar 1 |
|
+5% |
| Mar 22 |
|
+2% |
| Apr 12 |
|
-1% |
| May 1 |
|
-3% |
| Today |
|
-5% |
Source: Binance funding rate data, BTC spot price. Two-month window.
|
|
|
MARKUS THIELEN, 10X RESEARCH
"Something structural is happening in the futures market - not a sentiment shift."
|
|
| The real story: a $58 billion carry trade |
|
Carry trade, in one line: a strategy where you go long one version of an asset and short another to capture the price difference between them, regardless of which way the asset moves.
The leading interpretation of the funding rate anomaly is that institutional desks are running exactly this kind of trade on Bitcoin. They buy spot exposure through ETFs - cleanest, most regulated route - and simultaneously sell Bitcoin futures. The futures-spot price gap (the basis) is the yield they pocket. They aren't bearish. They're harvesting a spread.
The size of the spot leg matters. Cumulative net inflows into U.S. spot Bitcoin ETFs since January 2024 launch now sit at $58.5 billion. BlackRock's IBIT alone holds approximately 812,000 BTC - around 62% of the ETF market. April pulled in another $2.44 billion, with Morgan Stanley's MSBT (launched 8 April) attracting $163 million in its first weeks with zero outflows.
When that much spot demand pairs with futures shorting on the other side, funding rates go negative not because traders are bearish, but because there is structurally more selling pressure on perpetuals than buying. The signal looks like fear. The mechanics are pure arbitrage.
|
|
CHART 2
Monthly U.S. spot Bitcoin ETF net flows
| Oct '25 |
|
|
|
+$4.0B |
| Nov '25 |
|
|
|
-$1.2B |
| Dec '25 |
|
|
|
-$1.6B |
| Jan '26 |
|
|
|
-$1.8B |
| Feb '26 |
|
|
|
-$1.4B |
| Mar '26 |
|
|
|
+$0.3B |
| Apr '26 |
|
|
|
+$2.44B |
$6B of net outflows Nov-Feb were absorbed by Q2 reversal. April was the strongest inflow month in 6 months.
Source: CoinDesk, CNBC. Cumulative net inflows since launch: $58.5B.
|
|
| The on-chain confirmation: RHODL at 4.5 |
|
RHODL ratio, in one line: a Glassnode metric that compares the value held by short-term Bitcoin holders (1 week) against long-term holders (1-2 years) - a rising ratio means coins are aging into stronger hands.
The RHODL ratio just printed 4.5. In Bitcoin's entire 15-year trading history, it has only been higher twice. In late 2015, the ratio reached 5.0 with BTC near $200 - what followed was a run to $20,000. In late 2022, it hit 7.0 with BTC around $16,000 - what followed was a run to $126,000.
Both prior readings marked the precise inflection point where a grinding bear market ended and a sustained bull market began. The mechanism is simple: when speculative short-term holders capitulate during a drawdown, the share of supply held by long-term, conviction-based holders rises. RHODL captures that re-balancing.
Bitcoin is currently down roughly 40% from its $126,000 October 2025 peak. The 50% drawdown at the February low flushed out the speculative leg of the cycle. What remains is a holder base that has, statistically, been here before twice - and both times the next move was up and to the right for years.
|
|
CHART 3
RHODL ratio at cycle bottoms - what happened next
|
LATE 2015
5.0
RHODL ratio
BTC ~$200
→ rallied to $20k
(100x in 2 years)
|
|
LATE 2022
7.0
RHODL ratio
BTC ~$16k
→ rallied to $126k
(8x in 3 years)
|
|
MAY 2026 (NOW)
4.5
RHODL ratio
BTC ~$78k
→ ?
3rd highest ever
|
Source: Glassnode RHODL ratio. Past performance is no guarantee of future returns - but two for two is a track record worth noting.
|
|
| Whales accumulating, fear in the streets |
|
Whale wallet, in one line: a Bitcoin address holding more than 1,000 BTC - around $78 million at current prices - typically associated with institutions, high-net-worth holders, or treasury entities.
Over the past six months, the number of whale wallets has grown by 142 addresses, reaching 2,028 in total. That is a meaningful net accumulation during the same window in which retail sentiment collapsed and the Fear & Greed Index fell to 26.
A joint Coinbase Institutional and Glassnode survey adds the second leg of the picture: 75% of institutional investors and 71% of retail investors now rate Bitcoin as undervalued. That level of cross-cohort consensus inside a Fear environment is genuinely unusual. In most prior cycles, institutions buy into weakness while retail panic-sells - the two groups disagree. Right now they don't.
When whales are accumulating, RHODL is at a cycle-bottom signal, ETF inflows are rebounding, and both retail and institutional cohorts agree the asset is undervalued - the headline fear reading is the dissonance, not the data.
|
|
CHART 4
Whale wallets (1,000+ BTC) - 6-month growth
| Nov '25 |
|
1,886 |
| Jan '26 |
|
1,930 |
| Mar '26 |
|
1,980 |
| May '26 |
|
2,028 |
+142 addresses (+7.5%) added during a 50% price drawdown
Source: Bitcoin Magazine Pro. Y-axis floor 1,850 for visual clarity.
|
|
|
THE NZ ANGLE
Reading signals when the headlines disagree with the structure
For Kiwi stackers, this week's data is a useful reminder that no single metric tells the whole story. The funding rate alone says one thing. The funding rate read alongside ETF flows, RHODL, and whale accumulation says something quite different.
When fear is at 26, both retail and institutions agree the asset is undervalued, and on-chain conviction sits at a level historically followed by sustained bull markets - that is a market in disagreement with itself. Disagreement is where a DCA strategy earns its keep.
If you're stacking through Stacked, every weekly auto-buy you've placed since February has hit at prices the on-chain data is now flagging as a generational accumulation zone. The future will tell us whether the pattern holds. The on-chain data is suggesting the position is already set.
|
|
Stack accordingly,
Simon |
| |
|
stackedbitcoin.com
Stacked is a New Zealand-based, Bitcoin-only, non-custodial exchange and wallet platform.
FSP1005773.
This newsletter is general commentary, not financial advice. Bitcoin is volatile.
Do your own research and only invest what you can afford to lose.
Subscribe to the newsletter
|