|
EDITION 07 |
|
A world first: the global database of wasted energy
|
|
An exclusive first look for Stacked readers at Every Last Joule - the world's largest open-source database of curtailed renewable energy and flared gas.
|
 |
|
Many of you know that I am a part-time Bitcoin researcher through my work with DARI.
Today we are giving Stacked customers a first look at a new, as-yet-unreleased database and website that demonstrates two things at once: that the framing of Bitcoin's energy use as problematic is misguided, and just how valuable a large, flexible load can be to renewables when their generation is undervalued by the grid and its customers. Having a flexible buyer like Bitcoin could be a game-changer for renewable developers - if they take up the opportunity.
The Every Last Joule database is the world's largest open-source catalogue of wasted and curtailed renewable energy, drawn live from grid operators in 384 regions across 195 countries.
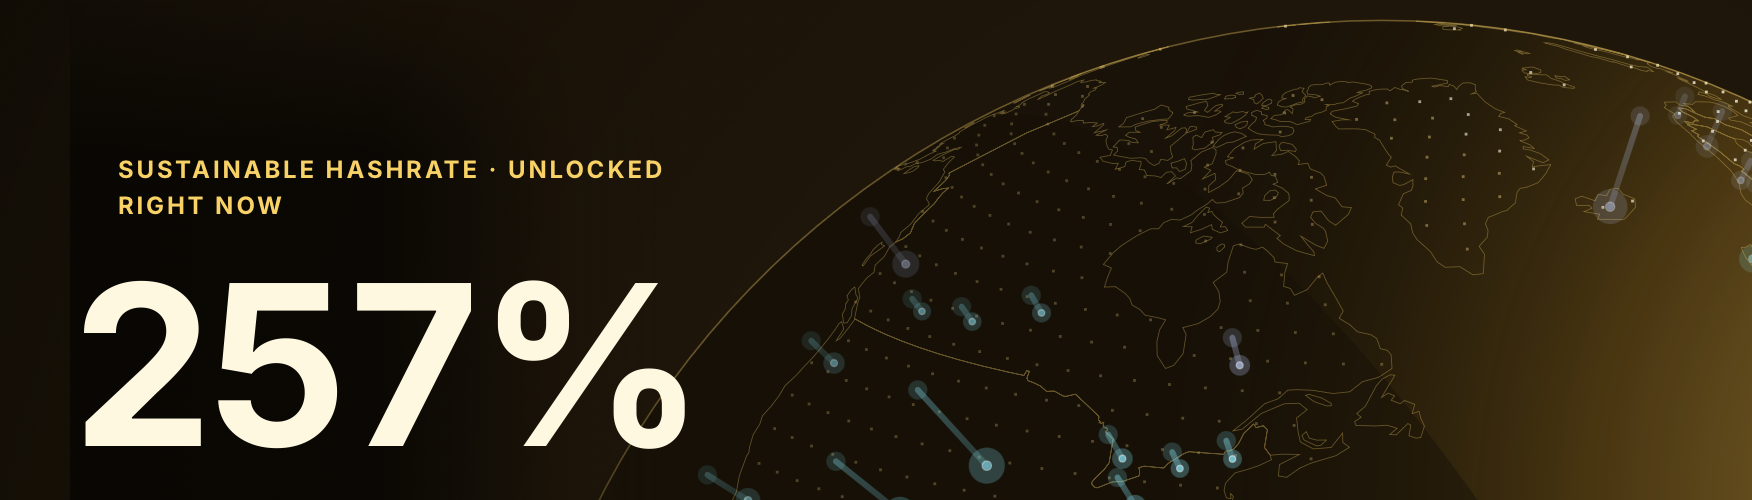
The headline finding is striking: at today's hashrate, the renewable energy currently thrown away - or never generated despite the capacity to do so - routinely matches and at peak hours significantly exceeds what the entire Bitcoin network consumes. The energy is already there. It is simply being wasted.
|
|
384
Regions monitored across 195 countries
|
Up to 384%
Peak share of Bitcoin's hashrate already covered by curtailed renewables
|
|
149
Regions with live, hourly grid-operator feeds
|
8
Major gas-flare basins tracked separately as base-load waste
|
|
What is curtailment, really?
|
|
A wind turbine in Scotland spinning hard on a winter afternoon, paid to switch off because the transmission cables south to England are full. A solar farm in California, dialled back to a fraction of its output at noon because there is nowhere for the electricity to go. A hydroelectric reservoir in Sichuan opening its spillway gates in monsoon season, letting cubic kilometres of head water rush past the turbines because the powerhouse downstream cannot dispatch any more megawatts.
All three are the same thing. Curtailment: clean, paid-for, ready-to-use energy that the grid cannot absorb in the moment it is produced, and so deliberately discards.
It happens because the electricity grid was built around predictable, dispatchable power stations - coal, gas, nuclear, large hydro - that turn on when demand calls for them. Wind and solar do not work that way. They generate when the wind blows and when the sun shines, regardless of whether anyone needs the power right then. When supply runs ahead of demand and transmission, something has to give. In a well-designed market, prices crash and the most expensive plants shut off first. But when too much renewable capacity hits a constrained grid, the cheapest, cleanest electrons get switched off instead.
In Germany this routinely produces negative electricity prices - generators paying the grid to take their power. In Britain it produces eye-watering compensation bills paid by consumers to switch wind farms off. In California it produces the famous "duck curve": a residual demand profile so deformed by midday solar that gas plants now ramp up and down on schedules their engineers never designed for. Every one of these symptoms points at the same underlying problem. The grid does not have a buyer of last resort.
|
|
The four faces of waste
Dispatch-down · A grid operator instructs a renewable plant to generate below its available output to maintain system stability (think EirGrid's SNSP cap in Ireland, or AEMO's SEMIDISPATCHCAP in Australia).
Constrained-off · Generation that physically cannot leave the area where it was produced because transmission lines are at capacity (the B6 boundary between Scotland and England is the canonical case).
Hydroelectric spill · Reservoir inflow exceeding what turbines and dispatch can absorb. Itaipu in flood-stage. Sichuan during the monsoon. Paraguay's December rains.
Steam venting · Geothermal plants in places like Kenya's Olkaria field running overnight against demand that doesn't exist, venting steam to the atmosphere because the wells cannot simply be shut down and restarted.
|
|
And it is growing fast
|
|
The deeper any country goes into the renewable transition, the more it curtails. The UK paid wind farms to shut down 8.3 TWh of generation in 2024, up from 1.9 TWh in 2019 - a more than four-fold rise in five years, with the single biggest jump (+91%) coming in the last year alone. The bill landed on consumers: around £1.5 billion in 2025, paid to switch wind off and gas on. Without reform, the National Energy System Operator warns that figure could reach £8 billion a year by 2030.
It is not a UK story. California's CAISO curtailed 3.4 TWh of wind and solar in 2024, up 7-fold from 2018. Germany's solar curtailment surged 97% to 1.4 TWh in 2024. Spain cut nearly a fifth of its wind generation in May 2025, three times more than a year earlier. Brazil dialled solar back by 20% last August. China's worst provinces sit above 30% curtailment for both wind and solar. Cyprus curtailed almost half of its large-scale solar in 2025.
|
|
UK wind curtailment, TWh per year
Wind generation paid to switch off because the grid cannot carry it.
| 2019 |
|
| 2022 |
|
| 2023 |
|
| 2024 |
| |
| 8.3 TWh · +91% year-on-year |
|
Source: Renewable Energy Foundation; National Energy System Operator. The 2024 figure reflects full-year discarded wind energy.
|
|
|
The shape of a wasted day
Average solar curtailment in California by hour of day, spring 2024. Curtailment peaks at midday when solar generation is highest and demand is lowest - the canonical “duck-curve” problem.
| Peak at 13:00 · up to 25% of solar output curtailed. Demand picks up after 5pm just as solar falls off, forcing gas plants to ramp hard. Bitcoin miners are the only large load that can absorb the midday surplus and switch off at the evening peak. |
Illustrative spring-day shape based on CAISO published dispatch data and EIA hourly curtailment reporting. The kind of diurnal pattern Every Last Joule captures across 149 live grid-operator feeds.
|
|
Putting numbers on it
|
|
Until now, there has been no single place where this data lives. National reports are buried in regulator PDFs. ISO dispatch series are scattered across a dozen formats. The biggest curtailment numbers tend to surface as anecdotes in industry newsletters or quarterly investor presentations - never aggregated, never compared, never tracked through time.
Every Last Joule pulls dispatch data directly from system operators - EirGrid, AEMO, ONS Brazil, ENTSO-E, CAISO, ERCOT, Elexon, Transpower and dozens more - and reconstructs every grid's curtailment shape at hourly UTC resolution. Where a TSO publishes the figure directly, the dashboard uses the figure. Where it doesn't, it applies a 2024-anchored rate published by that jurisdiction's regulator. Every assumption is source-cited; every loader is reproducible from a clean build with one command.
Gas flaring is tracked separately. Eight basins - the Permian, both Siberias, southern Iraq, eastern Saudi Arabia, Qatar, Kuwait and Yamal - burn continuously, 24/7, regardless of grid demand. Folding them into the headline ratio would flatten the diurnal signal, so they sit as a continuous base-load footnote underneath the renewables figure.
|
|
"Curtailed renewables already match Bitcoin's network energy on a typical day, and significantly exceed it at peak hours - and the gap is widening every year."
|
|
Why this matters right now
|
|
For the past decade, the dominant criticism of Bitcoin mining has been its energy use. The number quoted is usually around 138 TWh per year - roughly Thailand's annual consumption. That number is real. What the critique has always missed is the shape of that load.
Bitcoin miners are the most flexible large-scale electricity buyer ever built. A miner can switch off in seconds when the grid needs the energy elsewhere, and switch back on the moment it doesn't. There is no warm-up time, no production schedule, no contractual minimum take. Pair a Bitcoin mine with a curtailed wind farm and you do not need to build storage, you do not need to build transmission, you do not need to wait for the duck-curve problem to be solved. You just need to point the otherwise-wasted electrons at a machine that earns when they flow and shuts off when they don't.
AI data centres - the load that is now overtaking Bitcoin in the energy conversation - cannot do this. Training runs and inference workloads need 24/7 stable power and tight uptime SLAs. They are the wrong customer for an over-supplied renewable grid. They will outbid renewables for firm base-load every time, and they will leave the curtailed joules untouched.
This is the shape of the next decade: more renewable capacity coming online, more curtailment as transmission and storage lag, and more competition for firm base-load from AI. The renewable operators who pair their assets with a flexible buyer of last resort capture revenue from joules they would otherwise have written off. The ones who don't, won't.
|
| |
|
A win for vibe-coding
A solo researcher, a laptop, and an open-source dashboard
A few years ago, a data product covering 384 regions across 195 countries, with hourly upstream feeds from dozens of grid operators, would have meant a team of engineers, six figures of contractor budget, and a vendor lock-in to one of the big energy-data platforms.
Every Last Joule was built by one part-time researcher with Claude Code, Observable Framework, and a strong opinion about transparent methodology. Every loader is open-source. Every assumption is in a markdown file in the repo. Anyone can clone it, run npm install && npm run build, and reproduce every figure on the dashboard from scratch.
When a peer review last month surfaced a 4x over-count on ENTSO-E zones, the fix landed in 24 hours and the published figures for Germany dropped from 3.7 TWh to 0.92 TWh on a 30-day basis - which then matched BNetzA's official 2024 figure within 15%. Open code, open methodology, fast iteration. That is what Bitcoin energy research should look like.
|
|
|
The NZ angle
Aotearoa's grid is in the database too
New Zealand sits in the highest-confidence tier on the dashboard, alongside Belgium, Denmark, the UK North Sea, and the five Australian NEM states. The data is pulled live, hourly, from Transpower's published dispatch series.
NZ's curtailment volumes are small today, but the structural pattern - high renewable penetration, long thin transmission, weather-driven oversupply - is the same one that turned ERCOT, the Iberian peninsula and Brazil's Northeast into the loudest curtailment stories on the planet. As more wind comes online in Southland and Manawatu over the next five years, this signal will only grow. Worth watching.
|
|
|
|
|
Open-source, methodology-cited, peer-reviewable. The code lives at github.com/honeybeesquad/every-last-joule-dashboard.
|
|
|
|
Stack accordingly. ⚡
Simon, Co-Founder
|
|
Stacked is New Zealand's Bitcoin-only exchange and non-custodial wallet platform. Financial Service Provider FSP1005773.
stackedbitcoin.com · Unsubscribe
|
|